In my previous post titled Wall Street Loves Great Product Design, I explored the link between...
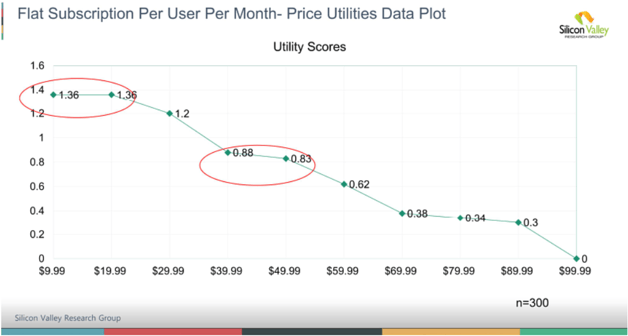
Could this be you? The above price elasticity curve is an actual plot from a recent price optimization study (client name and private information redacted).
While we often derive price elasticity curves with flatlining as shown above, this one may be the most dramatic I have seen showing two areas of flatlining on the curve.
In this case, potential customers who participated in our study showed a wider variety of price points that were acceptable because the offering, a new AI-based SaaS product, was a novel concept for which they had no previous frame of reference.
However, what is significant to note here is the flatlining. What this says is that the "share of preference", a proxy for predicting market share capture, in this simulation from our survey data is:
- The same whether the company prices at $9.99 or $19.99, i.e., potentially leaving $10 on the table if it selects the lower of the two price points
- Only slightly lower (0.89 versus 0.83) when comparing selecting a price point of $49.99 versus $39.99. In this case, however, the extra $10 earned from selecting the higher price more than compensates for the lower utility score.
Pricing for many SaaS companies has not changed for a while. We are not advocating for rapaciousness in an age of expected inflation. But we need to ask our clients and those in our research community the following three questions:
- You may have, at one point, established a price point you felt was optimal (you may even have conducted a price optimization study such as this one using conjoint analysis, price sensitivity analysis or another discrete choice methodology). But could that price point be lower than optimal today?
- A client I spoke to recently conceded that their price may be lower than expected but was comfortable leaving where it was in the hope of garnering more market share from their competitors. When I studied the pricing model however, I formed the hypothesis that besides leaving money on the table, their pricing being nearly 34% lower on average than other players in the space was likely to cause buyers, especially enterprise buyers, to cast aspersion on product quality or functionality. Again, this was a relatively new AI-driven category. So, if we had tested my "your price is too low and may impute low quality" hypothesis by running simulations on a conjoint survey data or a price sensitivity analysis survey, would we have found a flatlining or even negative sloping price elasticity curve?
- Last, but not least, customer expectations have risen in the past few months with the advent of AI. In December 2023, we conducted an executive opinion study, the results of which we published in our report titled "Shift Happens-the Changing Business Landscape in 2024". The upshot of the study was that while many companies were proceeding "gingerly" in 2024 to integrate AI into their business operations, they had very high expectations of their vendors moving quickly to infuse AI capability into their products as a "side-door" leading their organization into using more A.I. Given this, would the extra revenue from a price adjustment not be helpful in making investments in the race to improve your offerings with AI?
Don't miss a single issue: Subscribe above to receive insights and best practices from our research on the world's most innovative brands directly delivered each week to your inbox.
 Alan Nazarelli is Founder & CEO of Silicon Valley Research Group. Based in San Jose, CA with offices in Seattle and New York, the company works with the world’s most innovative brands to provide timely and actionable market intelligence and strategic guidance to enable them to make well-informed decisions to positively impact revenues and profits and to achieve their growth targets. Connect with Al on Linked in